
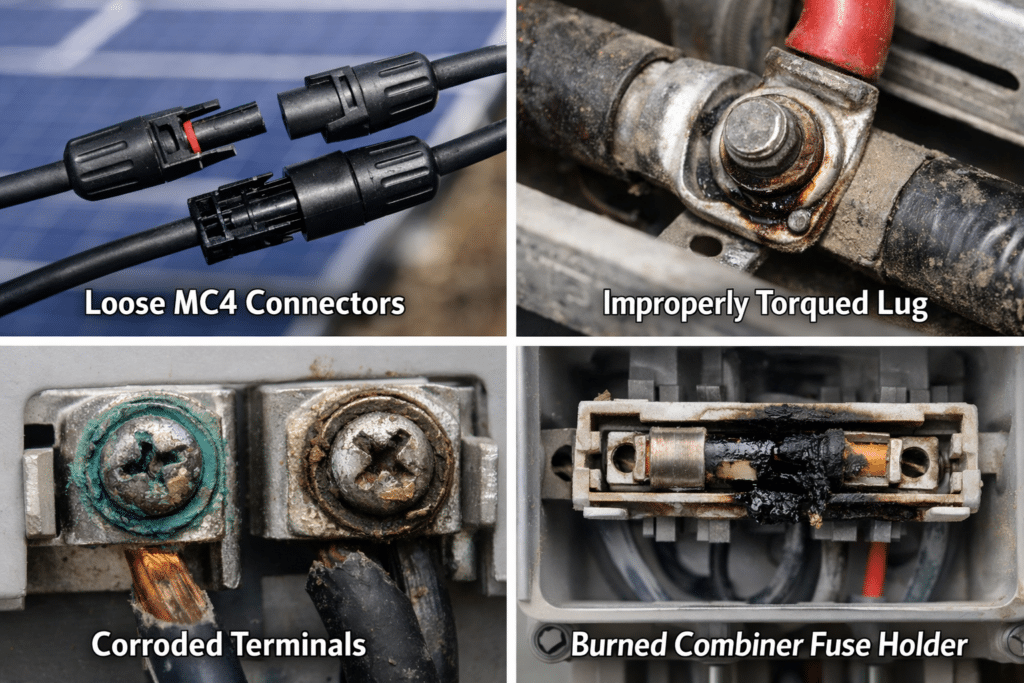
1️⃣ Loose or High-Resistance Connections
- Loose MC4 connectors
- Improperly torqued lugs
- Corroded terminals
- Burned combiner fuse holders
These create heat and voltage drop, reducing power output.
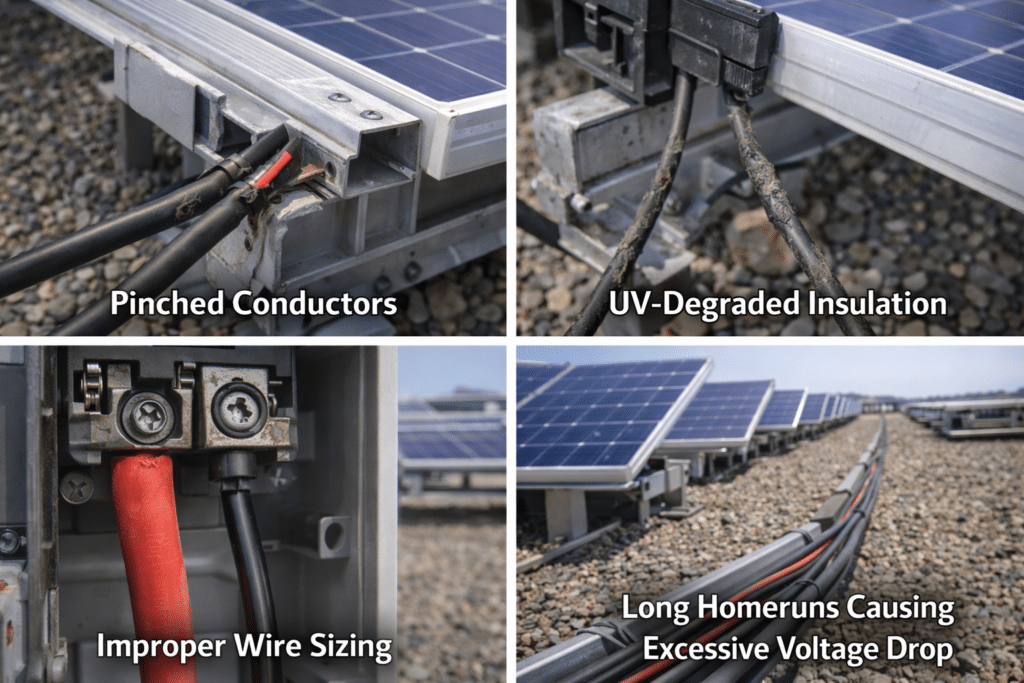
2️⃣ Damaged or Undersized DC Wiring
- Pinched conductors
- UV-degraded insulation
- Improper wire sizing
- Long homeruns causing excessive voltage drop
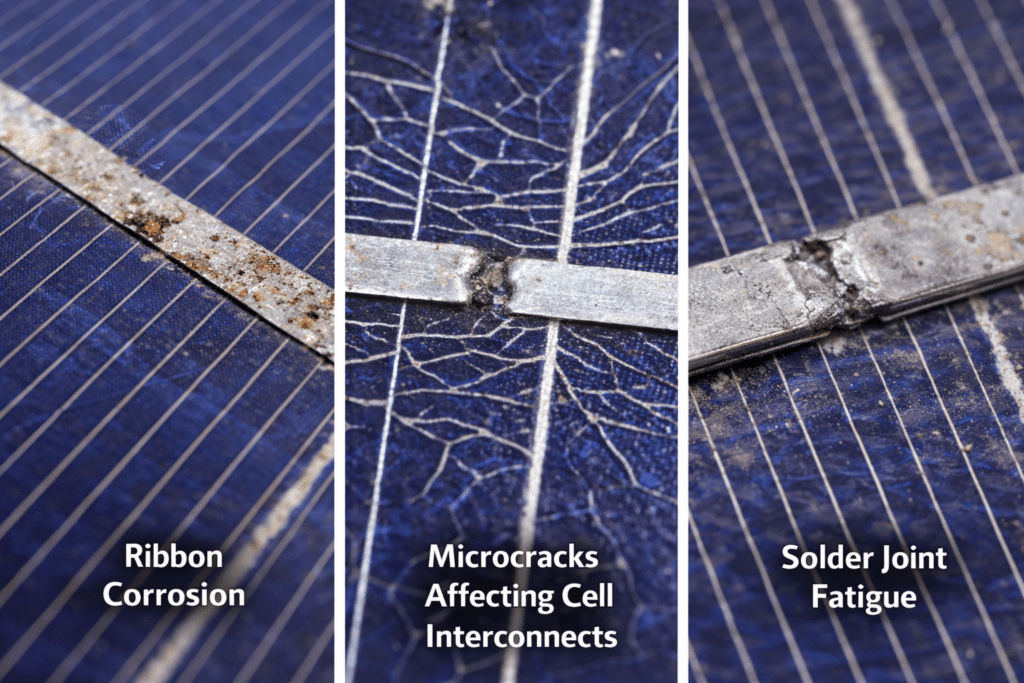
3️⃣ Degraded Module Internal Connections
- Ribbon corrosion
- Microcracks affecting cell interconnects
- Solder joint fatigue
4️⃣ Faulty Bypass Diodes
Bypass diode issues increase resistance and reduce current flow.
How IV Curve testing compares to thermography, DAS analytics, and insulation resistance testing—and how they work as a complete diagnostic stack.
1️⃣ IV Curve Testing
Electrical Performance Diagnostic
What it measures:
Current vs. voltage behavior of modules or strings under operating conditions.
Best at detecting:
- Power loss & underperformance
- High series resistance (loose connectors, corroded lugs)
- Bypass diode failures
- String mismatch
- Degradation (PID, LID, aging)
- Wiring voltage drop issues
- Fill factor reduction
Strengths
- Quantifies actual performance loss
- Identifies root electrical causes
- Commissioning validation
- Warranty documentation
Limitations
- Requires taking strings offline
- Snapshot in time
- Not always visual/locational without additional tools
Bottom Line:
IV curve testing tells you how much performance you’ve lost and electrically why.
2️⃣ Thermography (IR Drone or Handheld)
Thermal Anomaly Detection
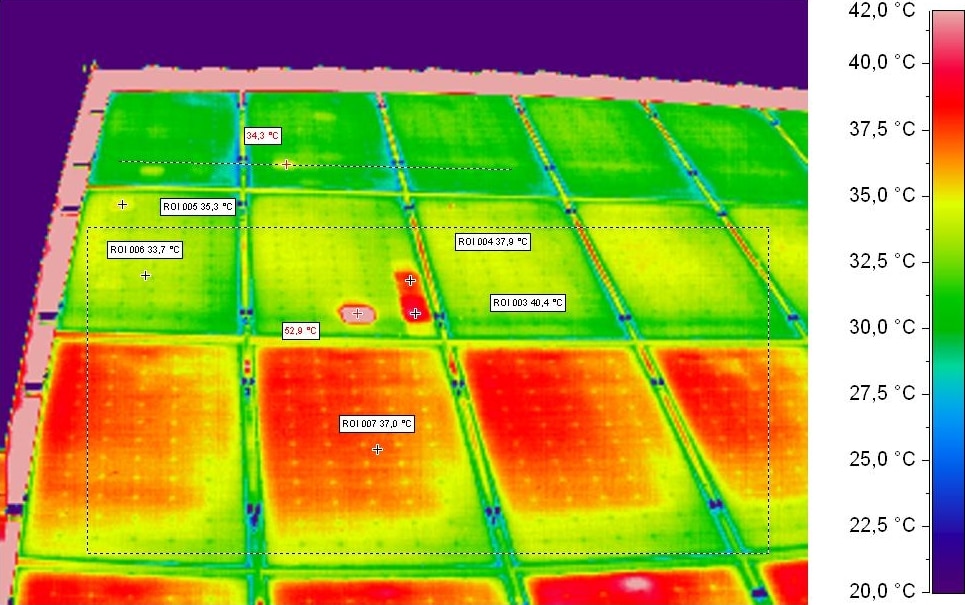
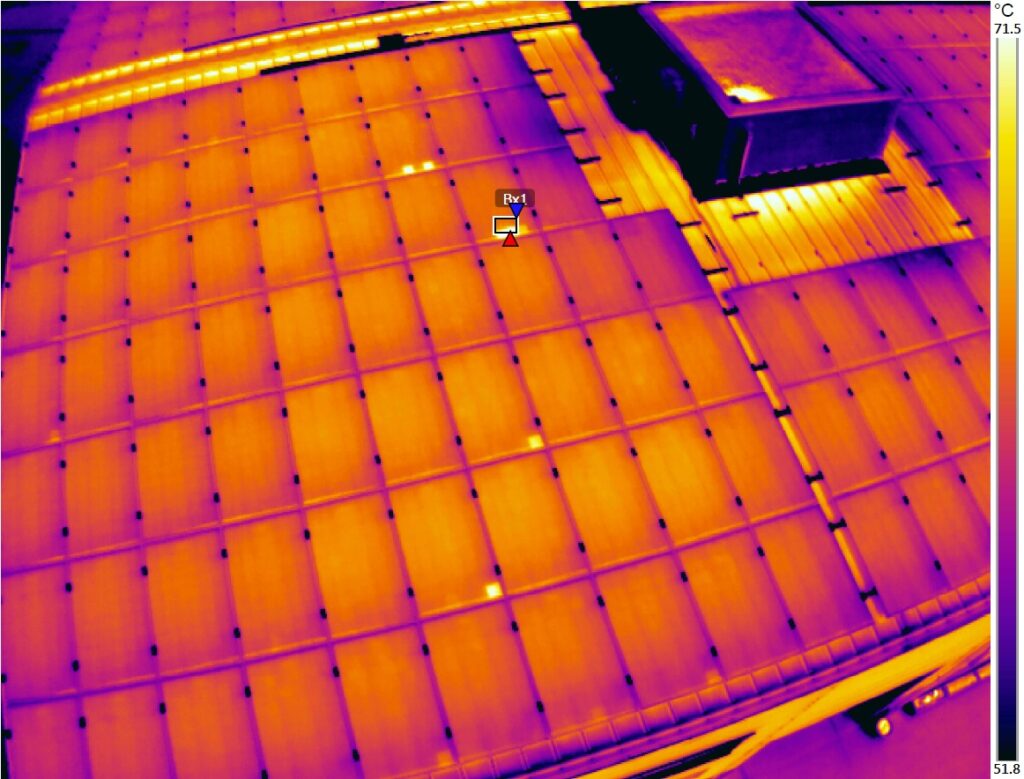
What it measures:
Temperature differentials across modules and electrical components.
Best at detecting:
- Hotspots from cracked cells
- Ribbon corrosion
- Bypass diode failures
- Loose connections
- Overheating fuses
- Combiner issues
Strengths
- Fast large-area screening
- Identifies exact physical location
- No shutdown required
- Excellent for preventive O&M
Limitations
- Environmental condition dependent
- Does not quantify total power loss
- Cannot measure electrical curve behavior
Bottom Line:
Thermography tells you where the problem is physically.
3️⃣ DAS Analytics (Data Acquisition System Monitoring)
Performance Trend & Data Intelligence
What it measures:
Real-time and historical production data at inverter, combiner, or string level.
Best at detecting:
- Long-term degradation trends
- Underperforming inverters
- Production anomalies
- Curtailment events
- Downtime tracking
- Seasonal performance variance
Strengths
- Continuous monitoring
- Scalable across portfolios
- Excellent for predictive analytics
- Great KPI tracking (PR, availability, yield)
Limitations
- Reactive unless properly configured
- Limited to sensor granularity
- Cannot physically diagnose root cause
Bottom Line:
DAS analytics tells you when something started going wrong.
4️⃣ Insulation Resistance (Megger Testing)
Safety & Ground Fault Diagnostic
What it measures:
Resistance between conductors and ground.
Best at detecting:
- Ground faults
- Moisture intrusion
- Insulation breakdown
- Pinched conductors
- UV-degraded insulation
- Rodent damage
Strengths
- Critical for safety compliance
- Prevents fire risk
- Required for commissioning and major troubleshooting
Limitations
- Requires system isolation
- Does not quantify performance loss
- Not a degradation diagnostic tool
Bottom Line:
Insulation resistance testing tells you if the system is electrically safe.
How They Work Together: The Complete Diagnostic Stack
Step 1: DAS Analytics Flags the Problem
Production anomaly or PR drop detected.
Step 2: Thermography Locates the Issue
Drone or handheld IR identifies hot spots or component overheating.
Step 3: IV Curve Quantifies the Impact
Measures exact power loss and electrical behavior distortion.
Step 4: Insulation Resistance Confirms Safety
Ensures no ground faults or insulation failures are present.
Strategic Comparison for Commercial Solar O&M
| Tool | Detects Performance Loss | Locates Issue | Ensures Safety | Trend Monitoring | Root Cause Capability |
| IV Curve | ✅ | ⚠️ Partial | ❌ | ❌ | ✅ High |
| Thermography | ⚠️ Indirect | ✅ | ⚠️ | ❌ | ⚠️ Moderate |
| DAS Analytics | ⚠️ Indirect | ❌ | ❌ | ✅ | ⚠️ Limited |
| Insulation Resistance | ❌ | ❌ | ✅ | ❌ | ⚠️ Limited |
For C&I Asset Managers
If you’re building a performance-driven O&M strategy:
- Quarterly DAS review
- Annual thermography
- Targeted IV testing on flagged strings
- IR testing during commissioning or fault investigation
That stack:
- Maximizes uptime
- Protects warranty claims
- Reduces fire risk
- Improves portfolio-level ROI