IV Curve vs Thermography vs DAS Analytics vs Insulation Resistance
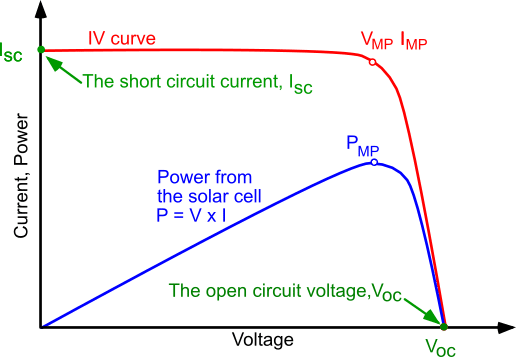
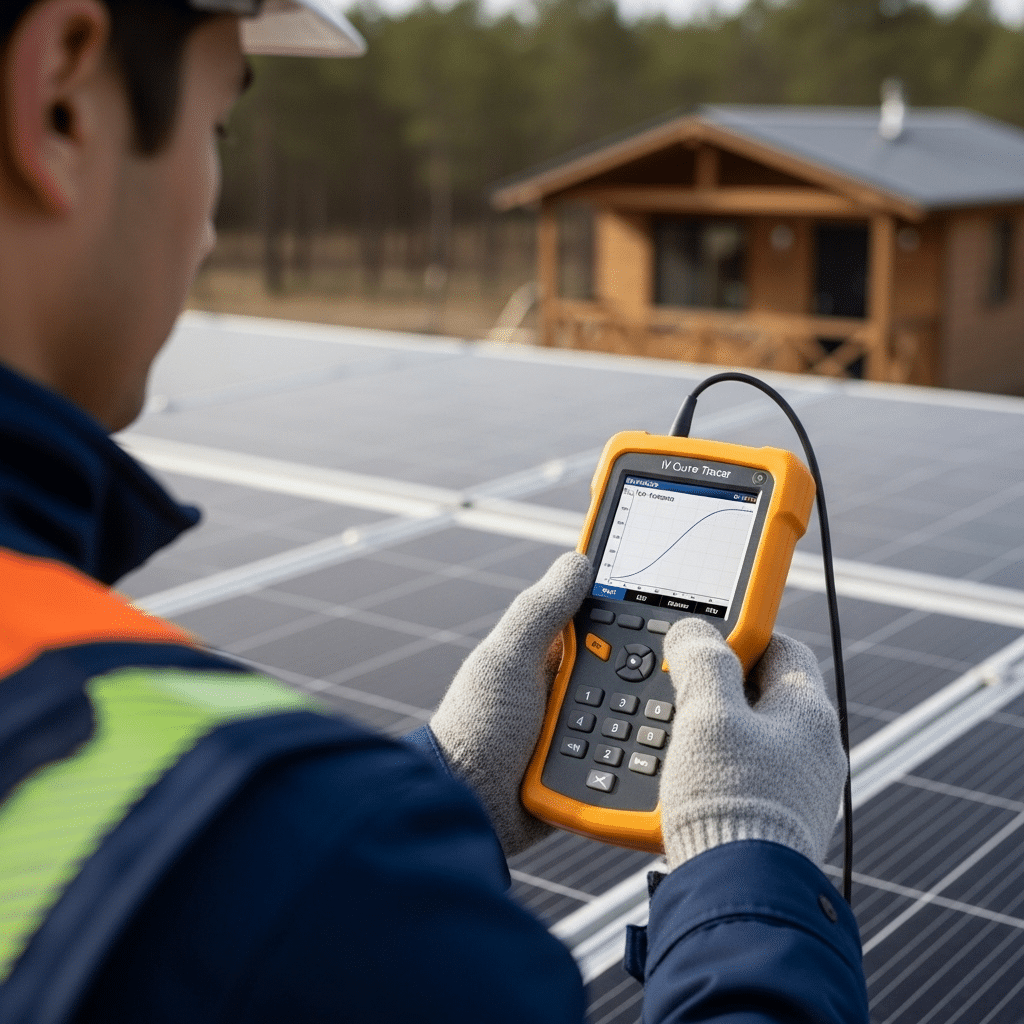
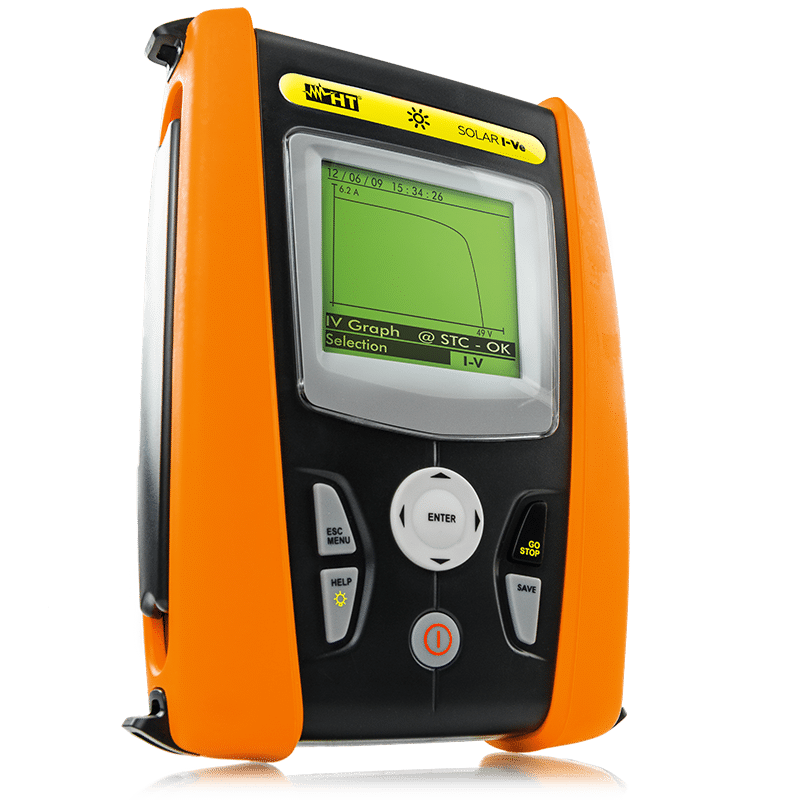
1️⃣ IV Curve Testing
Electrical Performance Diagnostic
Primary Purpose:
Quantifies string or module performance under load.
Detects:
✔ High series resistance
✔ Bypass diode failure
✔ String mismatch
✔ Degradation (PID, aging)
✔ Voltage drop issues
Best For:
• Warranty validation
• Commissioning verification
• Root cause performance analysis
Key Strength:
📊 Measures actual power loss (Pmax + Fill Factor)
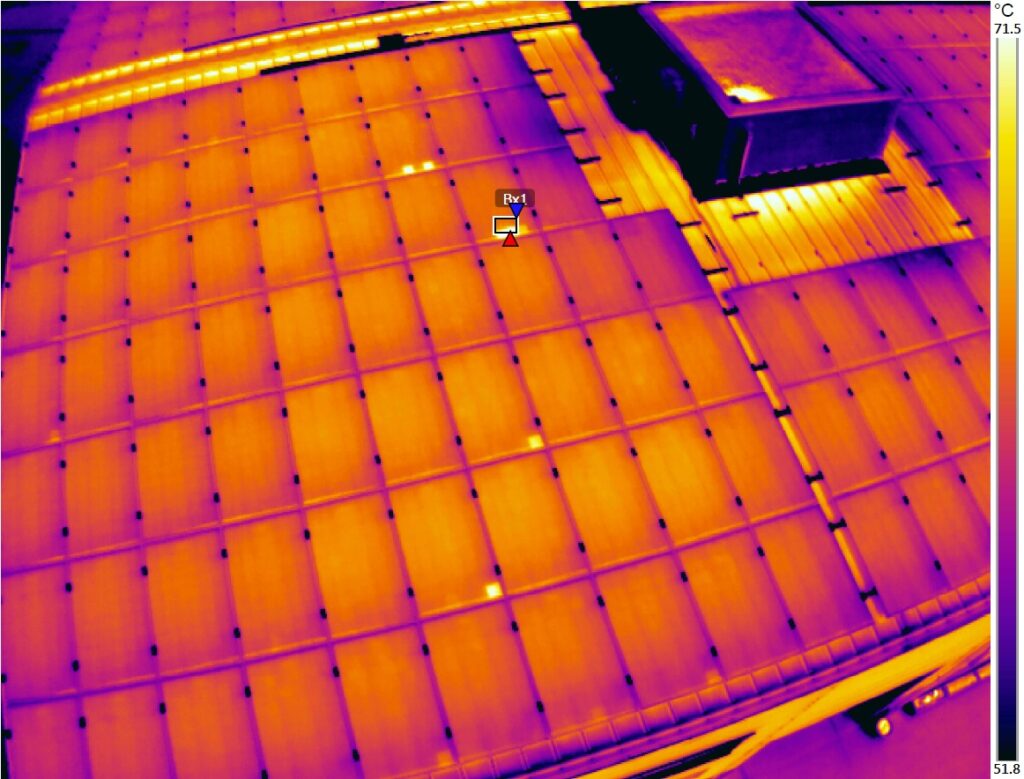
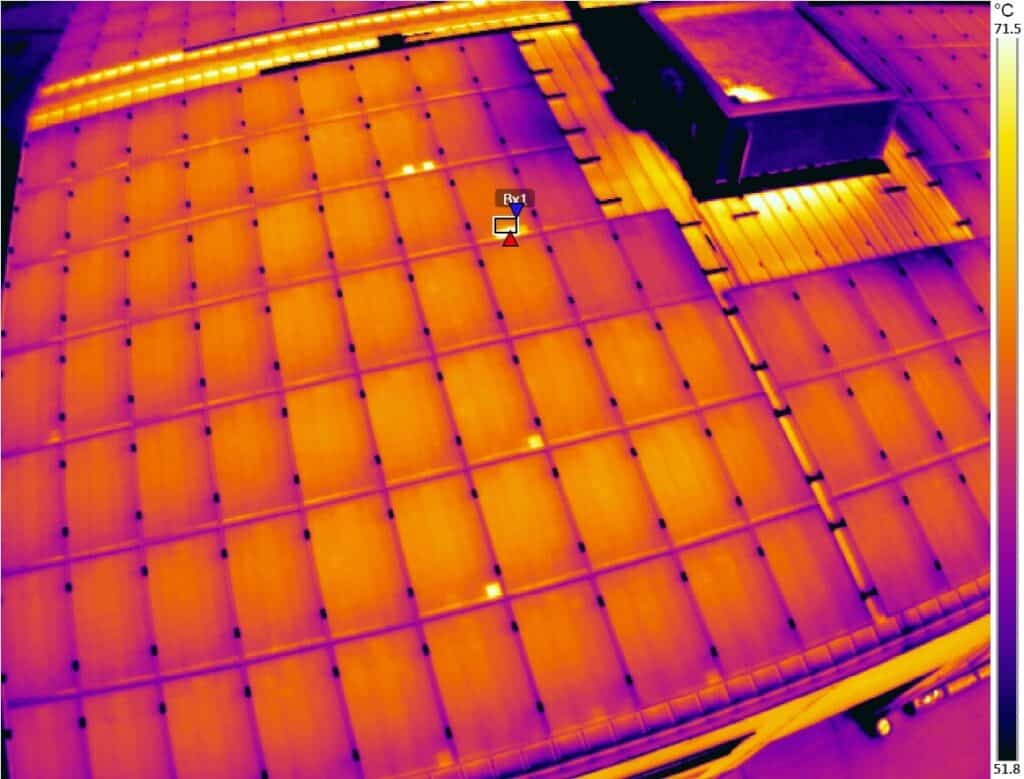
2️⃣ Thermography (IR Inspection)
Thermal Anomaly Detection
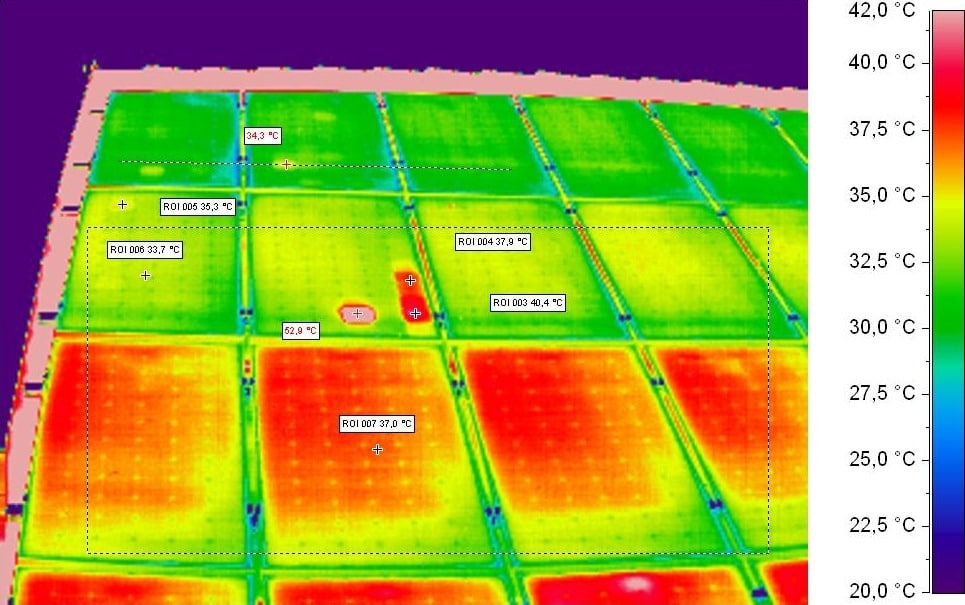
Primary Purpose:
Locates overheating components and module defects.
Detects:
✔ Hotspots
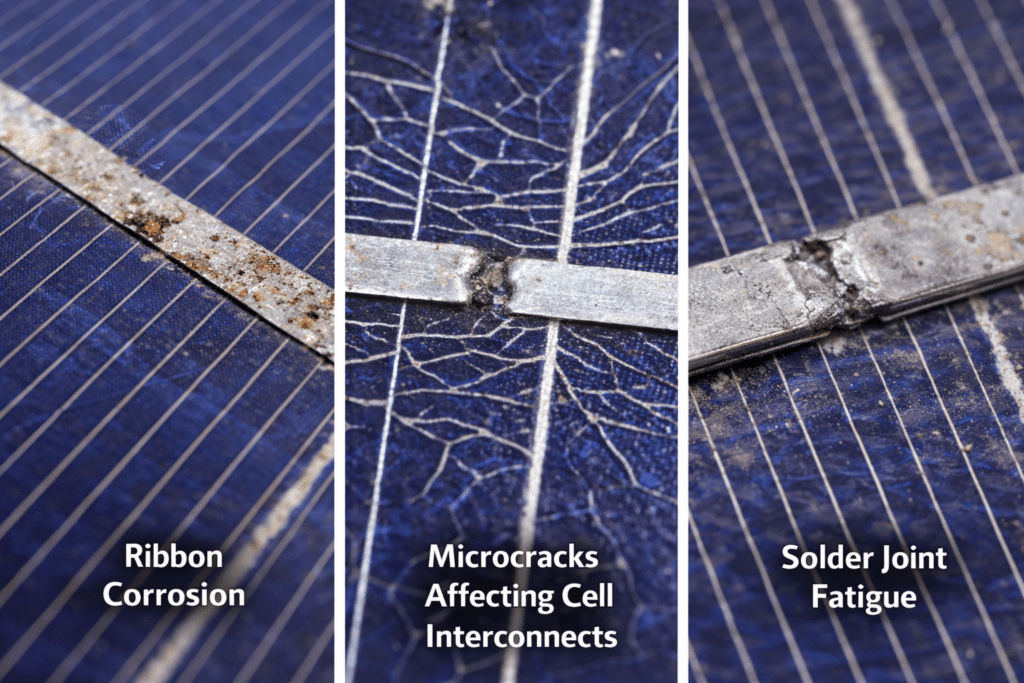
✔ Ribbon corrosion
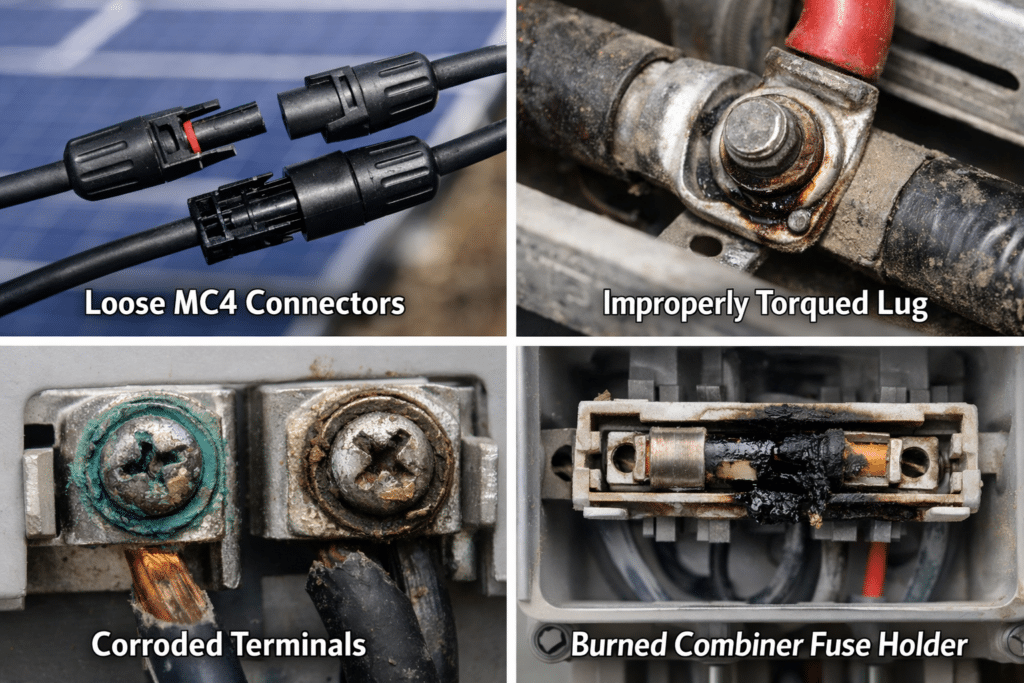
✔ Loose terminations
✔ Burned fuses
✔ Failing diodes
Best For:
• Rapid large-scale inspection
• Preventive maintenance
• Physical defect identification
Key Strength:
🌡 Shows exactly where the failure is
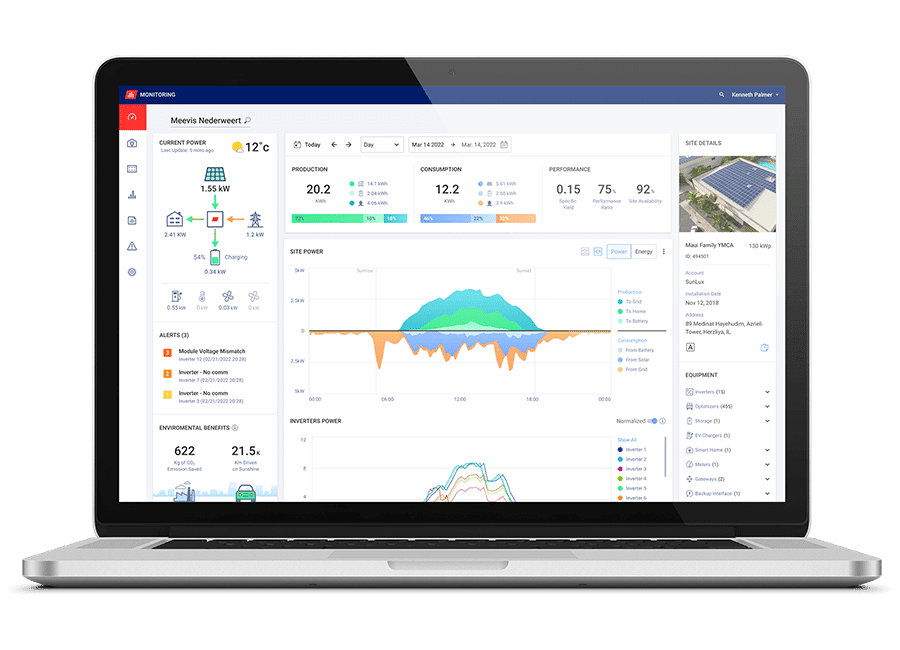
3️⃣ DAS Analytics
Data-Driven Performance Monitoring
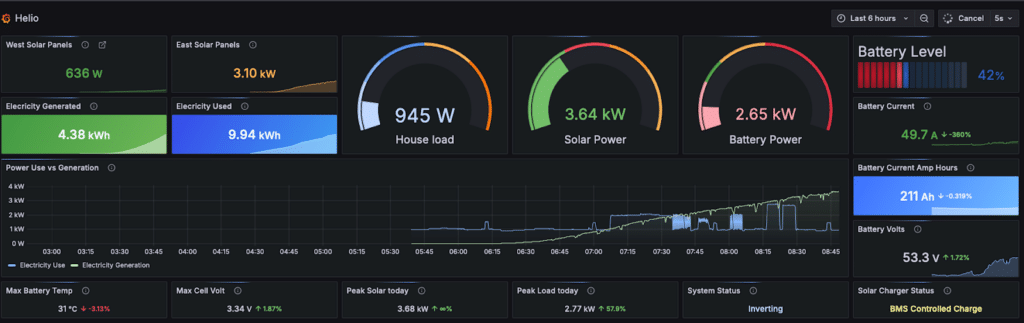
Primary Purpose:
Continuous performance monitoring.
Detects:
✔ PR drops
✔ Underperforming inverters
✔ Downtime events
✔ Curtailment
✔ Degradation trends
Best For:
• Portfolio oversight
• KPI tracking
• Predictive maintenance strategy
Key Strength:
📈 Tells you when performance changed
4️⃣ Insulation Resistance Testing
Safety & Ground Fault Diagnostic
Primary Purpose:
Validates electrical safety integrity.
Detects:
✔ Ground faults
✔ Moisture intrusion
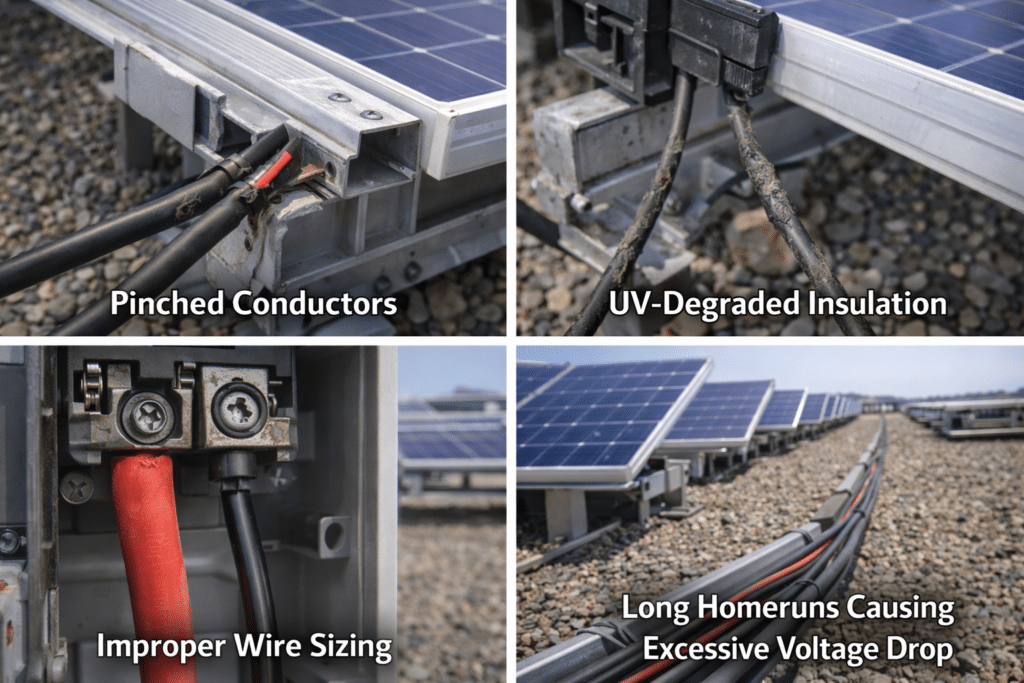
✔ Pinched conductors
✔ UV-degraded insulation
✔ Rodent damage
Best For:
• Commissioning
• Post-fault troubleshooting
• Fire risk prevention
Key Strength:
⚡ Confirms system is electrically safe
🔄 How They Work Together (Diagnostic Stack Flow)
1. DAS flags anomaly →
2. Thermography locates defect →
3. IV Curve quantifies power loss →
4. Insulation Resistance confirms safety
Executive-Level Comparison
| Tool | Finds Power Loss | Locates Failure | Monitors Trends | Confirms Safety | Root Cause Depth |
| IV Curve | ⭐⭐⭐⭐ | ⭐⭐ | ⭐ | ⭐ | ⭐⭐⭐⭐ |
| Thermography | ⭐⭐ | ⭐⭐⭐⭐ | ⭐ | ⭐⭐ | ⭐⭐⭐ |
| DAS Analytics | ⭐⭐ | ⭐ | ⭐⭐⭐⭐ | ⭐ | ⭐⭐ |
| Insulation Resistance | ⭐ | ⭐ | ⭐ | ⭐⭐⭐⭐ | ⭐⭐ |
💡 Takeaway for Commercial Solar Asset Managers
A high-performance O&M strategy doesn’t rely on one tool.
It layers:
- Continuous monitoring (DAS)
- Annual thermal scans
- Targeted IV curve testing
- Safety validation testing
That combination protects:
- ROI
- Warranty claims
- Insurance compliance
- Fire risk exposure
- Long-term asset value